 Gabriel Neila
Enterprise SaaS · Data visualization · Design leadership
Sprinklr Display Platform
How a social-display tool that depended on custom code became a scalable enterprise product for large-format data storytelling.
The 30-second version
Short on time? These four cards are the whole case study.
Problem
Display’s flexibility depended on customer-specific CSS and JavaScript. Larger data feeds and denser contact-center layouts made that hard to scale.
My role
Hands-on product designer from 2017, then manager of the three-person global team responsible for Display delivery from 2021.
What I did
Designed customer Displays, prototyped missing behavior in code, brought recurring needs to Product and Engineering, and built delivery practices for the team.
What changed
Semantic sorting and responsive widgets became native. Configurable widgets cut project development hours by 25%, and clearer delivery rules raised monthly project completion by 30%.
The product
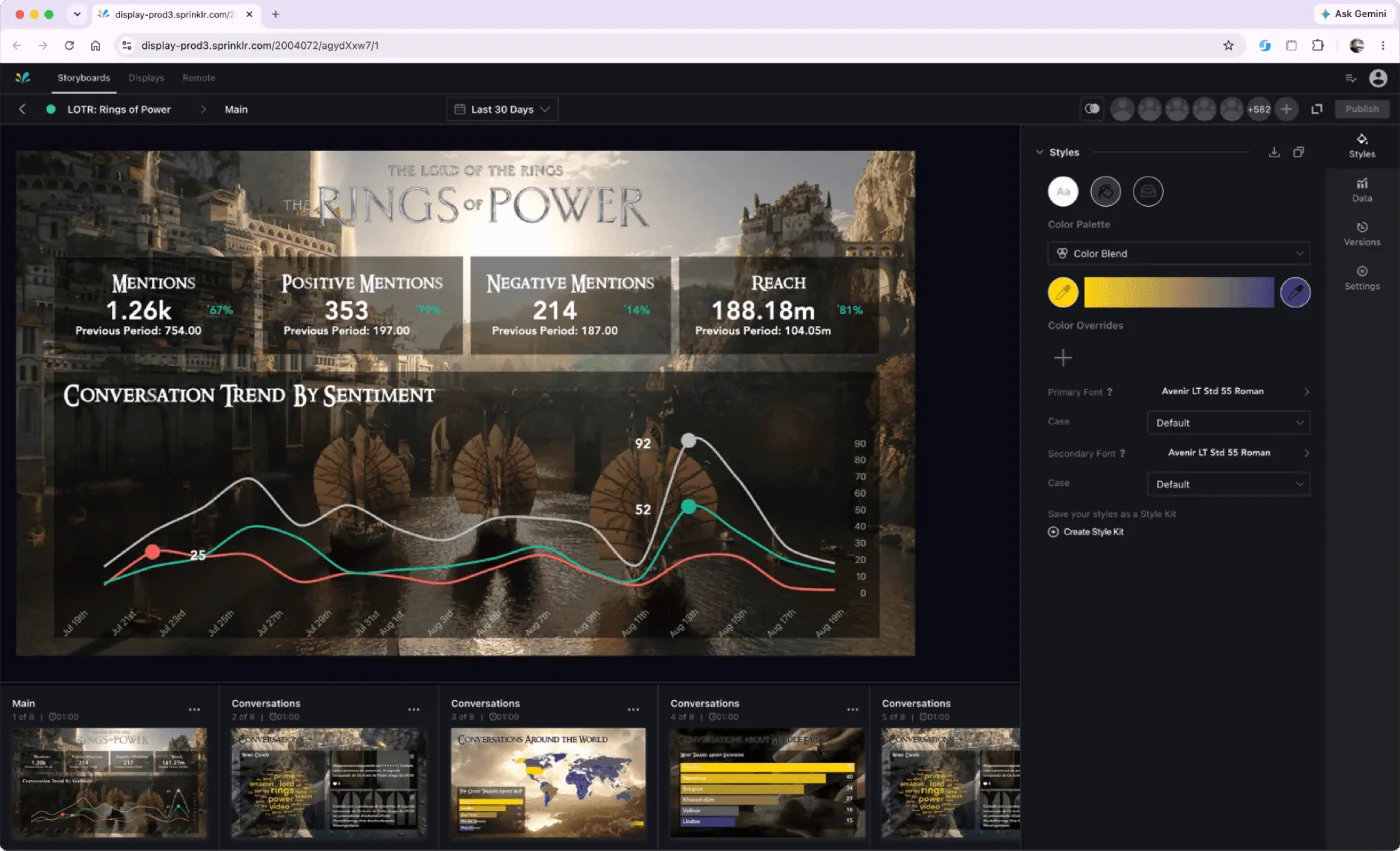
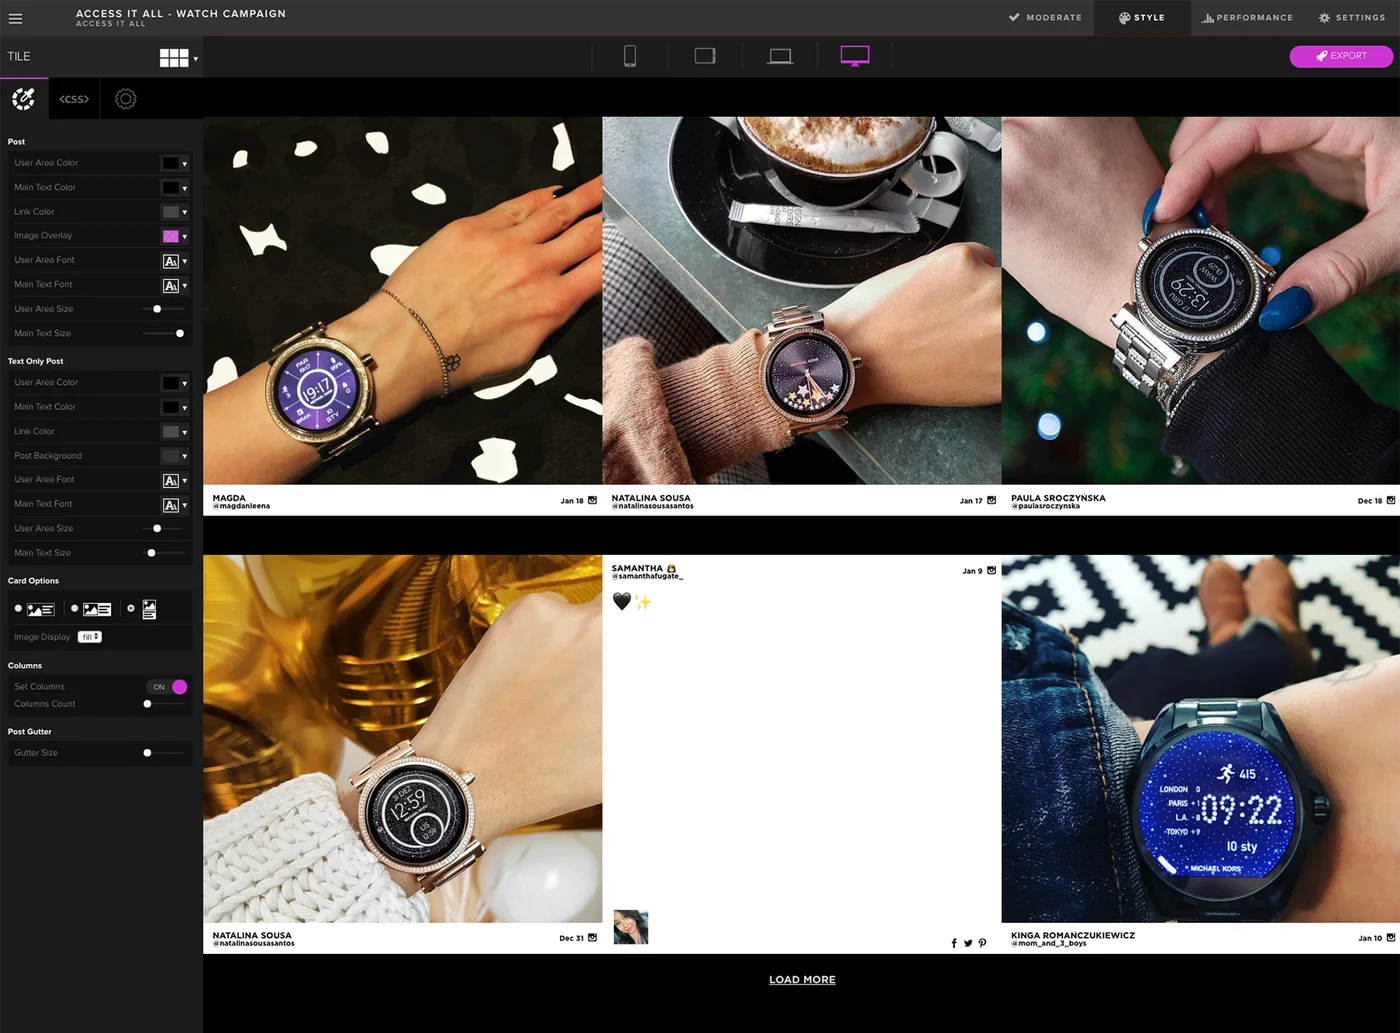
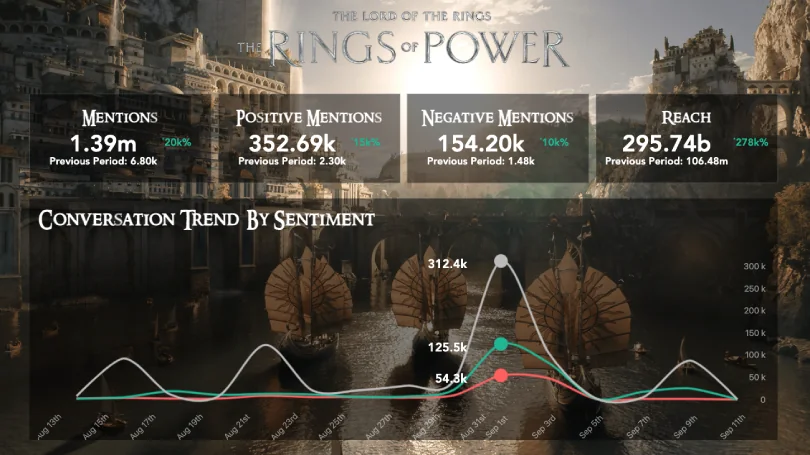
Sprinklr Display turns data from the Sprinklr platform into branded visual stories for command centers, executive spaces and events. Unlike a dashboard, it runs continuously on large screens and has to communicate without anyone touching it.
Sprinklr acquired Postano in 2016 and began folding its social-display model into the wider platform. I joined in 2017, while that transition was underway.
What large screens demand
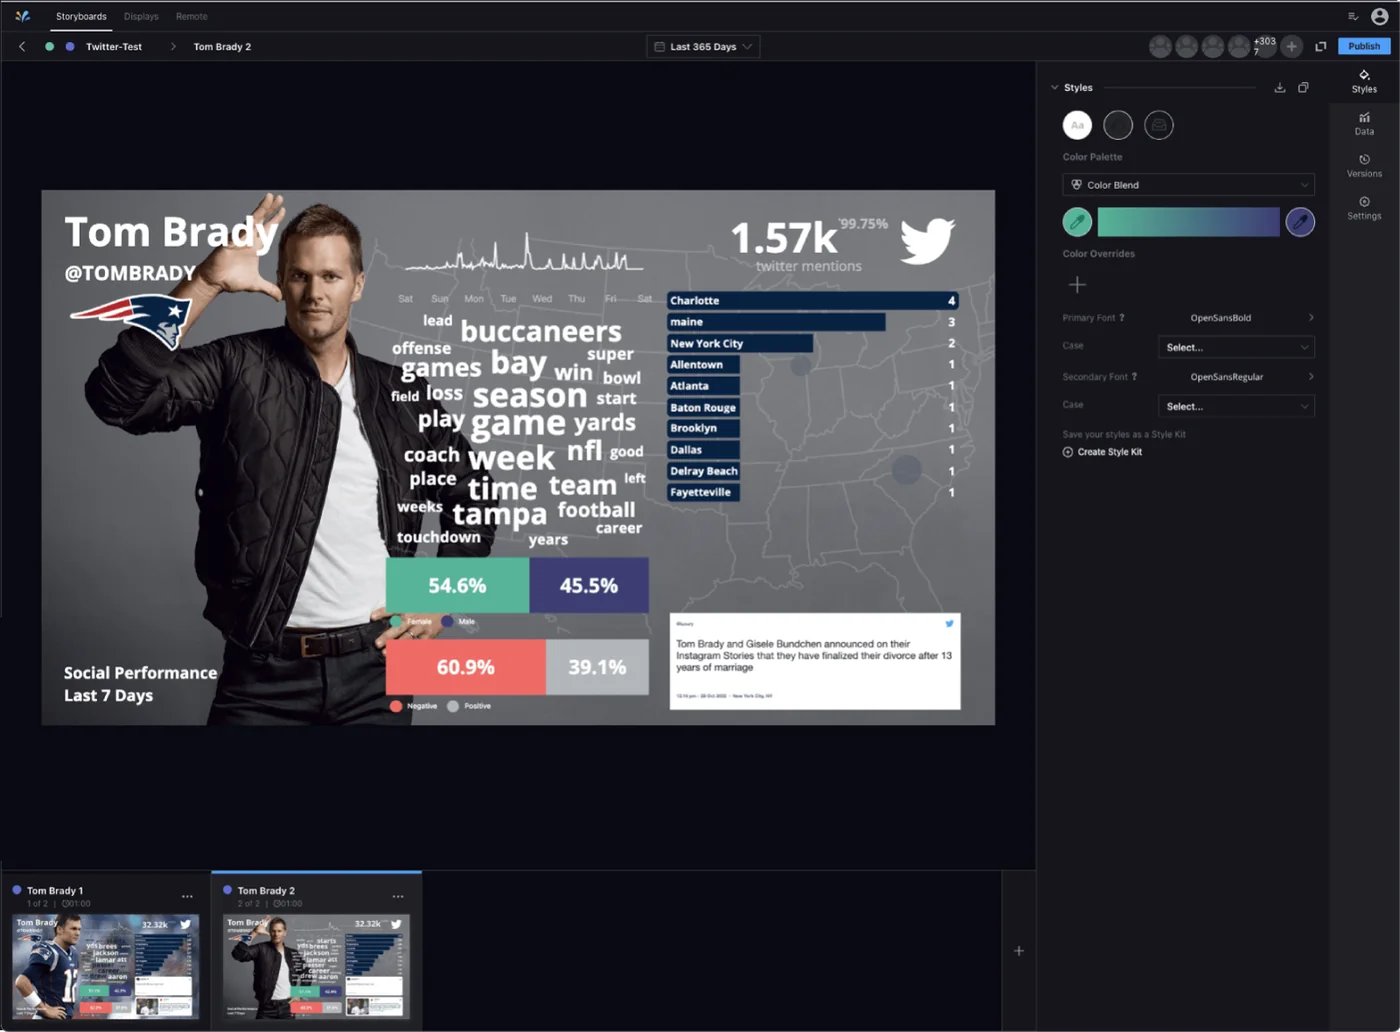
A Display is not a dashboard made bigger. Viewers may see a slide for a few seconds, from several feet away.
- GlanceabilityThe main message lands within seconds.
- Distance legibilityType, contrast and spacing hold up across a room.
- HierarchySome metrics deserve attention; most do not.
- MotionAnimation guides the eye without competing with the data.
The challenge
Customization did not scale with customer needs. Getting a Display to behave the way a customer wanted often meant writing CSS or JavaScript for that one customer.
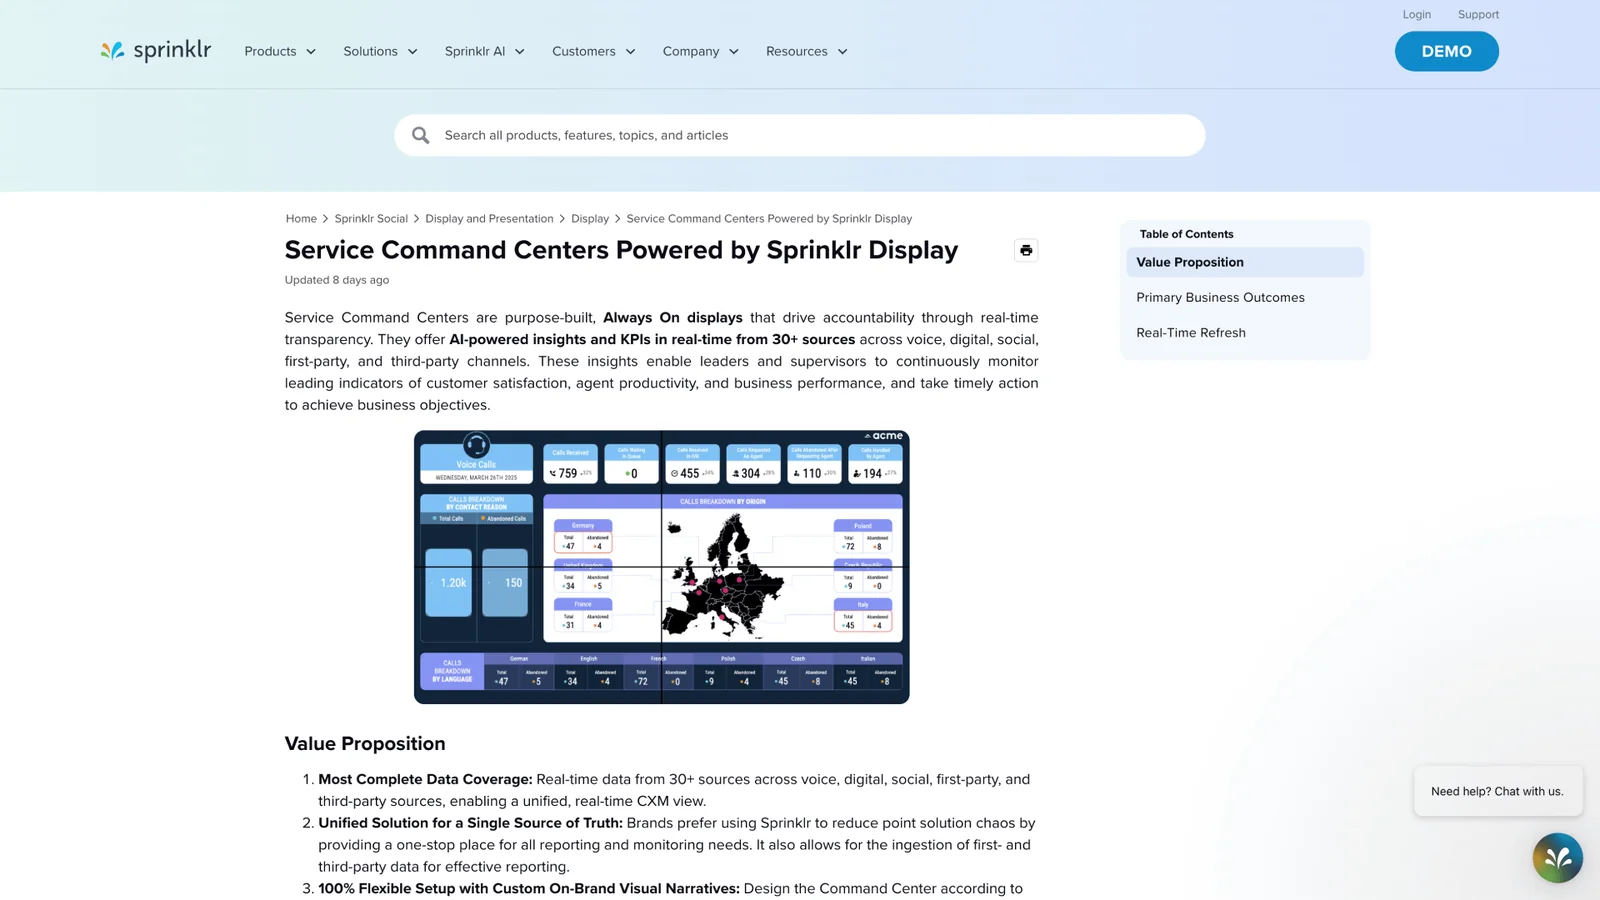
As Display took on richer data and information-dense contact-center (CCaaS) layouts, the same gaps kept reappearing across projects, and each one was solved again by hand.
From workaround to native feature
When the same limitation showed up across projects, I documented the need, tested possible behavior in code and shared the evidence with Product and Engineering. They decided the final scope and built the native capability.
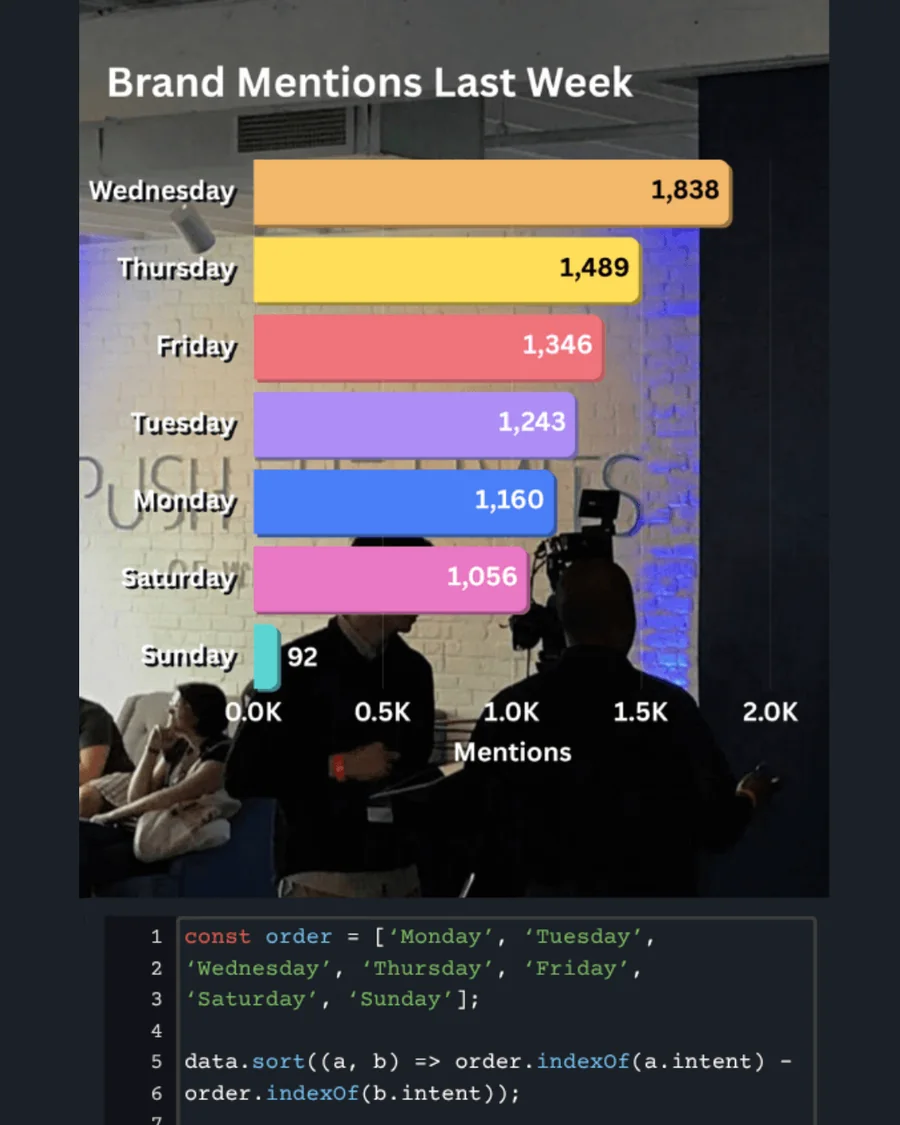
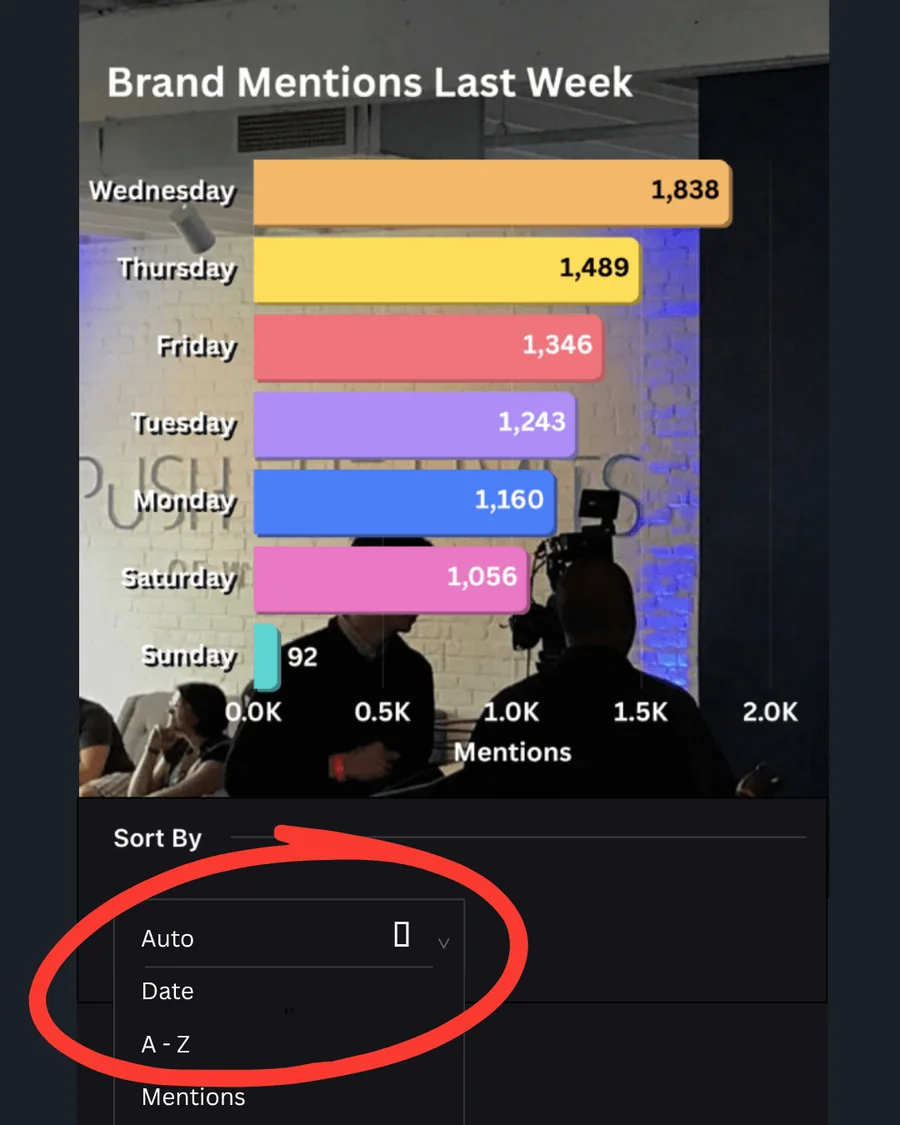
Making data order meaningful
- Platform defaultData appeared in default or alphabetical order, which did not match how customers think about their metrics.
- Custom prototypeI built JavaScript reordering, validated the behavior with customers and documented the need.
- Native capabilityProduct shipped semantic sorting controls, so custom ordering no longer needs code.
Adapting widgets to denser layouts
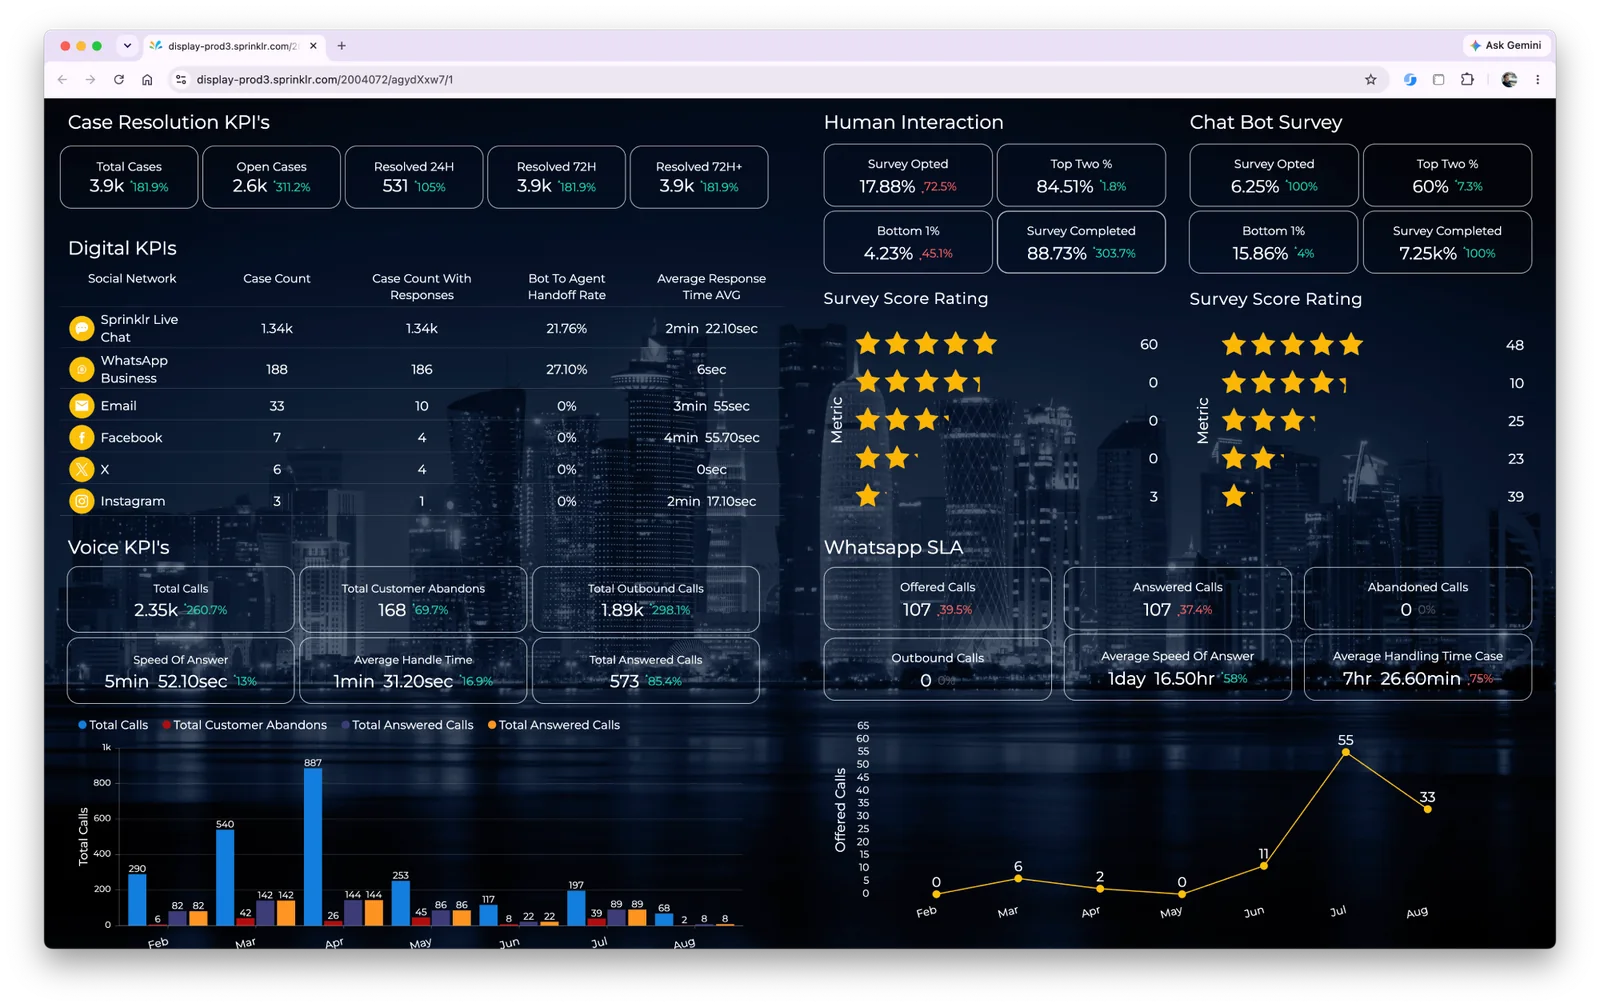
Contact-center environments needed more information in less space. I used code overrides to build responsive layouts so operators could see what mattered without losing context. Responsive behavior for selected widgets later became part of the product.
Not everything became a feature
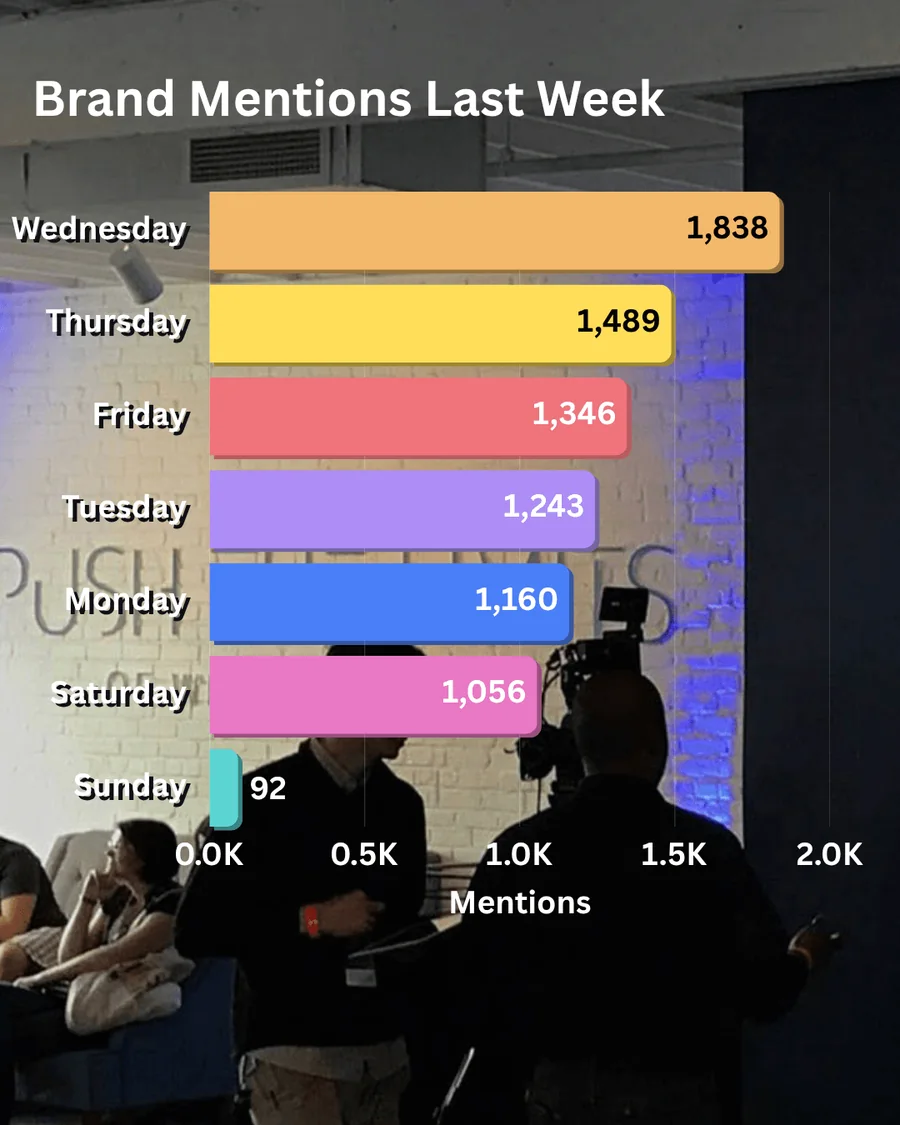
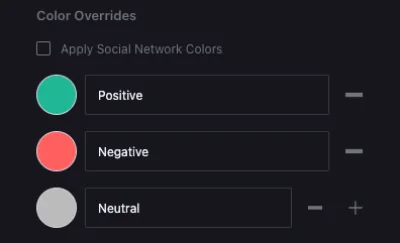
Brand-specific color overrides, legibility treatments over imagery and one-off layout or animation needs stayed custom. Code was still the right tool when a need belonged to one customer, dataset or room.
Leading the team
In 2021 I became Product Design Manager, leading three designers across New York, London and Dubai while staying involved in complex customer work.
- Allocated work across overlapping global projects.
- Reviewed hierarchy, visual direction and implementation trade-offs.
- Helped designers work through product constraints and Engineering dependencies.
- Represented the team’s delivery needs in product and roadmap discussions.
Making delivery reliable
Projects grew more complex, and four things made them harder: data that was incomplete at kickoff, requirements that changed mid-project, short timelines and several Display requests running at once. Layout and hierarchy could not settle until data, dimensions and priorities were confirmed.
What we put in place
- Approved data before designAn internal practice: metrics, labels and sources confirmed with the customer before layout work began.
- Reusable CCaaS patternsShared starting structures for metric overviews, trends, sentiment and queue performance.
- A five-day design windowA minimum design period added to the Statement of Work.
- Training and quick guidesEvery handoff included training. The guides were later added to Sprinklr’s Knowledge Base.
The five-day window
- Input reviewConfirm data, goals and requirements.
- HierarchyDefine structure, content and widgets.
- DirectionCreate and share design options.
- ReviewGather feedback and refine.
- HandoffFinalize and prepare implementation.
We also began treating significant post-build changes as additional scope. Together with confirmed data requirements and the five-day window, this raised monthly project completion by 30%.
Outcomes
- 30% more projects completed each month. Confirmed data requirements, a five-day minimum build window and treating significant post-build changes as additional scope.
- 25% fewer project development hours. Four JavaScript and CSS prototypes, built from customer feedback, became configurable widgets.
- A product back on the roadmap. Display moved from maintenance mode in 2022 to updates and a relaunch in 2025.
- Native semantic sorting. A customer-specific workaround became a reusable platform capability.
- Responsive widget behavior. Selected widgets adapt to denser layouts with less project-specific correction.
- Reusable CCaaS patterns. Designers start from proven structures instead of a blank canvas.
- Five-day SOW requirement. A realistic minimum design window for every project.
- Knowledge-base guides. Customer guidance that outlives the individual handoff.
My Display timeline
- 2017Joined during the platform redesign
- 2018Semantic sorting became native
- 2021Became Product Design Manager
- 2022First CCaaS implementation
- 2023–2024Product development resumed with drill-down exploration
- 2025Display updates and relaunch
- 2026Five-day requirement added to the SOW
What I learned
- Customer work reveals product needs. A problem that repeats across implementations is stronger evidence than a single feature request.
- Data and context set the hierarchy. The audience, the room and the available data decide what deserves attention.
- Leadership improves the conditions around the work. Clear ownership, careful review and reliable delivery practices help a team make better decisions.